




Enterprise Application
 Chand Prakash
23 October 2026
MCP integration for enterprise applications: architecture, use cases, security, and implementation
 Chand Prakash

A single IIS-hosted application with an event log was once manageable because teams could tail the log and trace issues directly. A containerized service calling several others behind a load balancer is far harder to diagnose with that approach. The diagnostic surface has changed, which is why .NET distributed tracing now plays a central role in production troubleshooting.
Modern .NET makes .NET OpenTelemetry practical because its core observability primitives already exist in the base class library. Activity, Meter, and ILogger already align with OpenTelemetry in .NET, so many teams need configuration more than new instrumentation code. In practice, teams completing a .NET Framework to .NET 10 Migration often have more telemetry available than they realize and are missing only an exporter.
This guide focuses on what to instrument first, how to order the rollout, and how to control telemetry cost. It also explains the mistakes that can make .NET observability expensive, disconnected, and less useful during real production incidents.
OpenTelemetry gives .NET teams a standards-based observability layer without tying instrumentation decisions to a single backend provider or platform. Three practical reasons, none of them ideological.
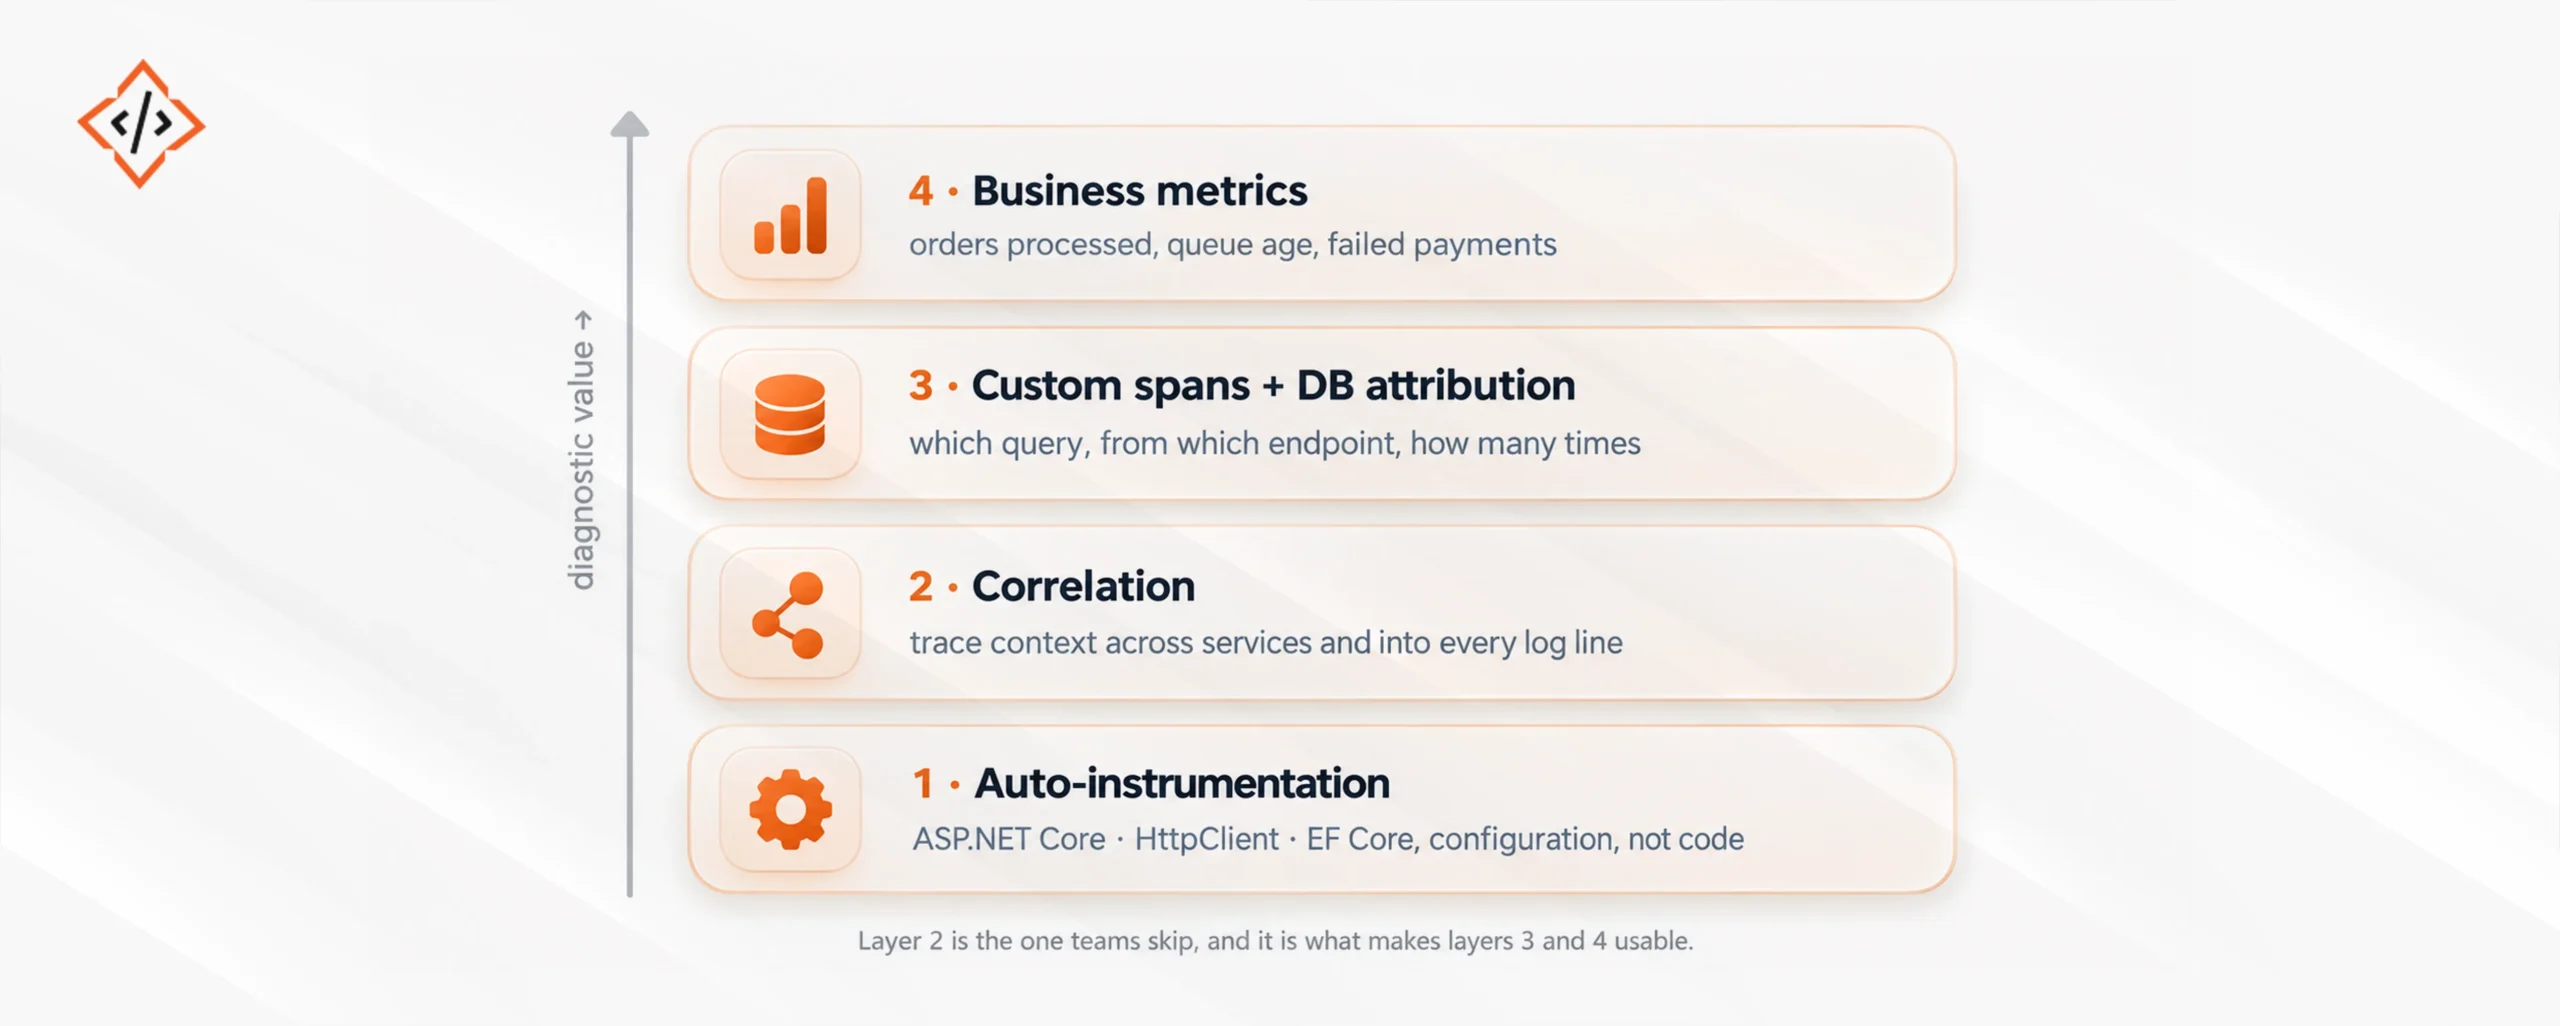
Build upward. Correlation is the low-cost layer that makes everything above it more useful.
Registering the ASP.NET Core, HttpClient, and Entity Framework Core instrumentation packages creates incoming request, outgoing call, and database spans. No application code changes are required. Runtime metrics, including garbage collection, thread pool activity, and exceptions, come from the same registration.
For most services, this level of OpenTelemetry instrumentation already answers a large share of routine questions.
This is the layer teams skip most often, and it is why many observability deployments disappoint.
Trace context must propagate across service boundaries through W3C traceparent headers. The .NET HttpClient instrumentation handles this automatically. Context must also flow into logs, so every log line carries the trace and span identifier.
Without that, a slow trace and the exception explaining it sit in different tools with no reliable way to join them. With correlation, moving between the two takes a click.
Message queues need explicit attention because context does not propagate through a broker automatically. It must be written into message headers and read on the other side.
Auto-instrumentation can show that a database call took 400 milliseconds. It cannot show that the same query ran 340 times in one request.
Attributing queries to the calling operation is the highest-value custom instrumentation available. It makes the N+1 pattern visible in production instead of only in a local SQL log. That pattern slows more Entity Framework Core endpoints than any other cause, as covered in ASP.NET Core performance tuning.
Add custom spans around meaningful business operations such as order submission, document generation, and external settlement. Avoid adding spans around every method.
Technical health is not the same as service health. A service returning HTTP 200 while processing zero orders is still broken. OpenTelemetry metrics such as counters and histograms for domain events answer questions that CPU dashboards never will.
If you have no tracing in place, register the auto-instrumentation packages and connect them to a backend. This usually takes an afternoon and delivers most of the value. You do not need an observability engagement for that setup.
If the plan is to Hire .Net Developer support for a full custom-span rollout across every service, push back. Start with auto-instrumentation and trace IDs in logs. Run it for a month, then add OpenTelemetry instrumentation where existing telemetry cannot answer your questions. Instrumenting everything upfront increases cost and makes useful signals harder to identify.
If the requirement is limited to dashboards for a status page, that is a different and less expensive solution than what is described here.
Observability bills can grow faster than traffic when no one owns them, and two factors account for most of that growth.
| Approach | How it decides | Trade-off |
|---|---|---|
| Head sampling | At the start of the trace, by percentage | Cheap and simple; discards errors at the same rate as successful traces |
| Tail sampling | After the trace completes, based on outcome | Keeps errors and slow traces; requires a collector to hold spans in memory |
Deploy the OpenTelemetry Collector as a sidecar or daemon instead of exporting directly from each application. The collector centralizes sampling, attribute filtering, and redaction. Changes can then be handled through configuration rather than an application redeploy.
Production observability often fails because small implementation choices weaken correlation, increase telemetry costs, and make incidents harder to diagnose. Five recurring mistakes, all avoidable.
One .NET-specific point also matters. Activity has been part of the base class library for years. Libraries emitting through it produce spans automatically once a listener is registered. Teams often find that the missing piece was simply an exporter. For containerized services, relevant deployment considerations after a runtime change are covered in running .NET on Linux and containers.
Layer 2 is correlation, and it is often the first layer teams skip during an observability rollout.
When a .NET observability engagement is scoped, the most visible deliverables usually receive the most attention. Dashboards, custom spans around business operations, and service maps are easy to evaluate. Correlation is different because it works in the background and produces no standalone artifact that demonstrates its value. As a result, it can become an easy line item to defer when budgets are reduced.
The impact appears later. Teams may have OpenTelemetry tracing in one tool and OpenTelemetry logging in another, but no reliable way to connect them. During an incident, engineers then have to match timestamps manually to understand what happened. That is exactly the problem observability is meant to prevent.
Layers 3 and 4 should therefore not be implemented unless correlation is included in the same phase. This is not about adding scope unnecessarily. Custom spans and business metrics depend on connected telemetry to provide useful diagnostic context. Without correlation, the later layers may exist technically but cannot deliver their intended value.
Treating correlation as a core requirement avoids that gap. Experience from production environments shows that delaying it often creates more operational work later and reduces the value of the entire observability setup.
A reliable .NET OpenTelemetry setup depends on getting the instrumentation order right from the start. Begin with auto-instrumentation because most of the required signals already exist in modern .NET. Add correlation next so trace identifiers connect logs with the requests they belong to.
Database attribution should follow because it exposes repeated queries and N+1 patterns in production. Business metrics come later, once technical signals can be tied to real service outcomes. Cost control also needs early planning across .NET development services. Set cardinality limits and choose a sampling strategy before telemetry volumes grow.
Tail sampling through a collector preserves errors and slow requests while reducing unnecessary trace storage. This makes .NET observability more useful without letting costs rise unchecked. Finally, alert on user-visible symptoms and use OpenTelemetry tracing to find the cause. Dashboards can show that something is wrong, but traces explain where the failure started and why it happened.

 Chand Prakash
 Chand Prakash
 Hardik Soni
 Bhavesh Kachadiya
 Bhavesh Kachadiya