AI, eCommerce & Retail 11 November 2026What is a retail analytics platform? A complete guide
Key takeaways:
- A retail analytics platform combines sales, inventory, customer, and store data so teams can make daily decisions from one source.
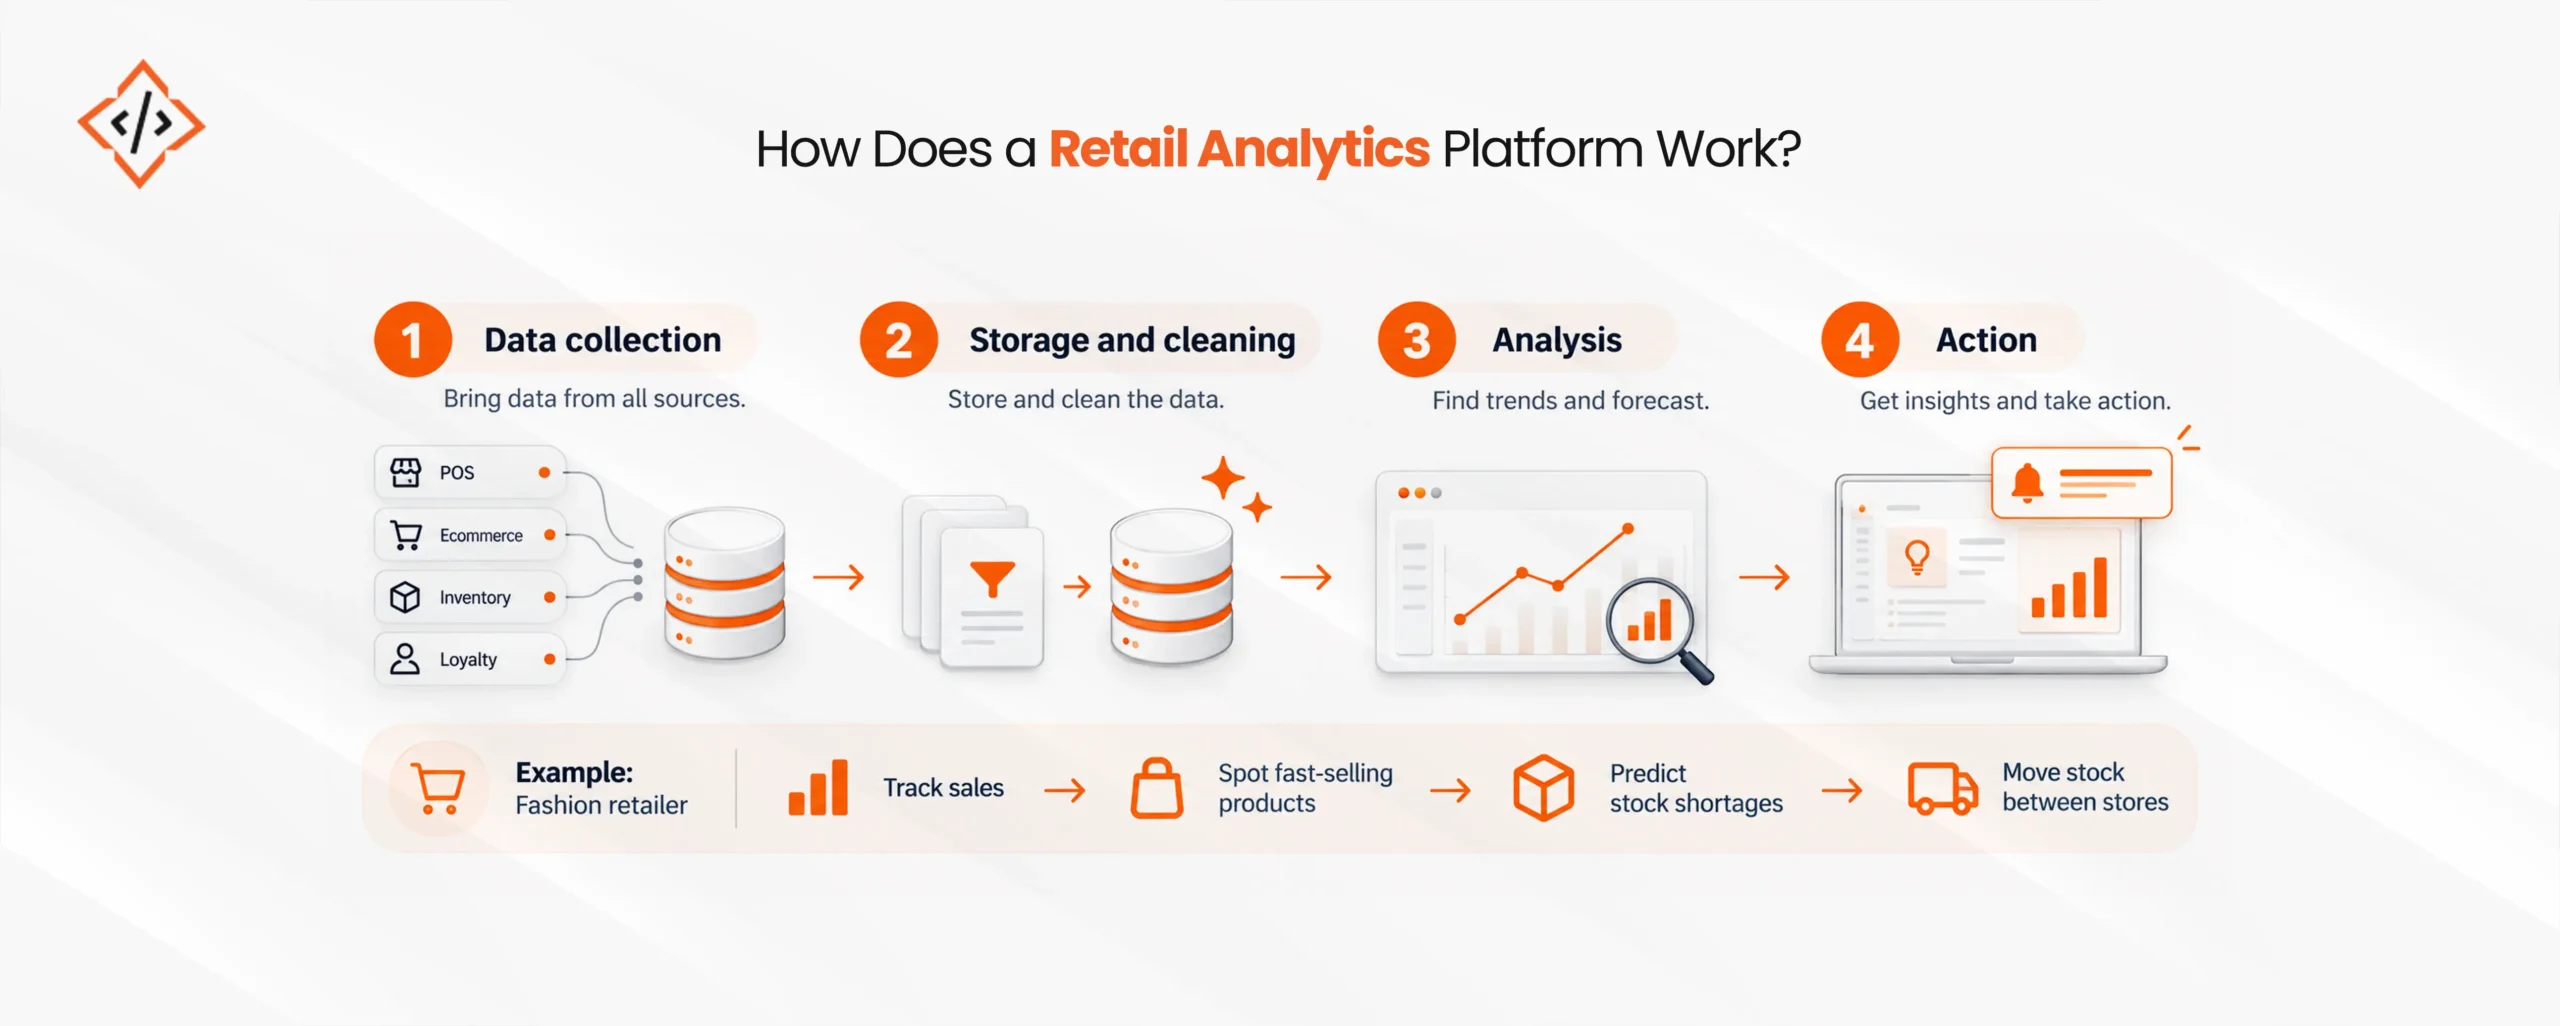
- Most platforms work in four layers, that is, data collection, data storage and cleaning, analysis, and action through dashboards or alerts.
- Inventory is often the fastest win, since out-of-stocks and overstocks cost retailers about 6.2% of global retail sales in 2026.
- AI-powered retail analytics adds demand forecasting, automatic alerts, and plain-language questions on top of standard reports.
- The right choice depends on data sources, team skills, and whether an off-the-shelf tool fits or a custom build makes more sense.
Introduction
Most retailers already have plenty of data.
The trouble is that it lives in different places, with sales in the POS, stock in the ERP, and customer details in the CRM. A retail analytics platform connects these systems, so a retailer can see which products sell, which ones sit on shelves, and which customers bring in the most revenue.
Retailers are investing heavily in these tools.
According to MarketsandMarkets, the global retail analytics market will grow from USD 11.31 billion in 2026 to USD 20.65 billion by 2031, at a CAGR of 12.8%.
This guide explains how these platforms work, which data they use, the metrics worth tracking, the role of AI, and how to choose and roll out the right solution.
It is software that collects data from across a retail business, organizes it, and presents it as reports, dashboards, forecasts, and recommendations. Put simply, it helps a retailer understand past performance, find the reasons behind it, and plan the next move.
Unlike a spreadsheet or a general reporting tool, retail analytics software already understands how retail works. It knows about store hierarchies, product categories, seasons, promotions, and stock levels, so analysts do not have to build that logic from scratch.
Many people also call this category retail business intelligence, since it brings BI methods to retail-specific problems.

Most platforms follow a similar four-step flow, whatever the size of the business. To make each step easier to picture, take the example of a fashion retailer with 20 stores and an online shop:
- Data collection: Connectors pull data from point-of-sale systems, ecommerce stores, inventory tools, loyalty programs, and other sources, either every few hours or in real time. For the fashion retailer, this means every till sale, online order, and stock delivery reaches the platform without anyone exporting files by hand.
- Storage and cleaning: The platform stores everything in a central database and tidies it up. It removes duplicate entries, fixes date and currency formats, and matches records across systems. For instance, the store POS may call a product “Denim Jacket Blue M” while the website uses the code DJ-BL-M. The platform links both to the same item, so sales are not counted twice or missed.
- Analysis: Once the data is clean, built-in models calculate metrics, spot trends, and run forecasts. The platform might find that the blue denim jacket sells three times faster in city stores than in suburban ones and that demand tends to rise when temperatures drop.
- Action: The findings appear as dashboards, weekly reports, and alerts. In this case, the buyer gets an alert that two city stores will run out of the jacket within five days, along with a suggestion to move extra stock from a suburban store. The decision takes minutes instead of a long spreadsheet exercise.
What data does retail data analysis use?
Retail data analysis usually draws on five kinds of data. The first four come from inside the business, while the fifth comes from outside it. Each one answers a different part of the picture, and the real value comes from reading them together.
- Sales data: Every transaction from stores and online channels, including the items bought, prices paid, discounts used, and time of sale. For example, sales data can show that a coffee shop chain sells most of its pastries before 10 a.m., which helps decide baking and delivery times.
- Inventory data: Stock levels, deliveries, transfers between stores, and shrinkage (stock lost to damage, theft, or errors), usually taken from inventory and ERP systems. This data shows how much of each item is available and where it sits.
- Customer data: Loyalty records, purchase history, and preferences stored in CRM tools. A beauty retailer, for instance, can see that a customer buys the same moisturizer every six weeks and send a reminder just before she is likely to run out.
- Store data: Visitor counts from door sensors, staffing schedules, and store layout details. When a store has high foot traffic but low sales, this data helps check whether the cause is too few staff at peak hours or products placed where shoppers miss them.
- External data: Weather, local events, festivals, holidays, and competitor prices. These factors often explain sudden changes that internal data cannot. For example, a spike in umbrella and raincoat sales makes sense once the platform links it to a week of heavy rain.
Four types of retail data analytics
Retail data analytics is usually grouped into four types. Each type builds on the one before it, moving from reporting the past to recommending the next step.
Most retailers start with descriptive reports and add the other types as their data improves. The table gives a quick summary, followed by a closer look at each type using the same fashion retailer example.
| Type | Question it answers | Retail example |
|---|
| Descriptive | What happened? | Weekly sales by store and category |
| Diagnostic | Why did it happen? | A sales dip traced to a stockout of a popular size |
| Predictive | What will happen? | Expected demand for winter jackets next month |
| Prescriptive | What should be done? | The best reorder quantity for each store |
Descriptive analytics
Descriptive analytics summarizes what has already happened. It turns raw transactions into totals, averages, and comparisons, usually shown on dashboards and weekly reports.
For example, the fashion retailer’s report shows that jacket sales fell 15% last week compared with the week before. This type is the starting point for every team, since it shows where to look next.
Diagnostic analytics
Diagnostic analytics explains why something happened. It breaks a result down by store, product, size, channel, or time, and compares it with related data such as stock levels or promotions.
In this case, the drill-down shows that the drop came from three stores that ran out of medium sizes, while other stores sold as usual. Customers still wanted the jacket, but the right sizes were not on the shelf.
Predictive analytics
Predictive analytics estimates what is likely to happen next. It uses past sales, seasonal patterns, planned promotions, and outside factors such as weather to forecast demand.
For instance, the platform predicts that jacket demand will rise by about 30% over the next month as winter sets in, with the biggest increase in city stores.
Prescriptive analytics
Prescriptive analytics recommends what to do about it. It weighs the forecast against current stock, delivery times, and costs, then suggests the best action.
Here, the platform recommends ordering 400 more medium jackets and sending most of them to the three affected stores first. The buyer reviews the suggestion and approves or adjusts it before the order goes out.
Core areas of retail analytics solutions
Most retail analytics solutions are built around five areas. Merchandising, store operations, and marketing teams each tend to own one or two of them.
- Retail sales analytics: Tracks revenue by product, store, channel, and time period, so teams can spot best sellers, slow movers, and seasonal patterns.
- Retail inventory analytics: Shows stock levels and turnover, and flags items at risk of running out or piling up. This matters because, according to IHL Group’s 2026 Inventory Distortion Study, out-of-stocks and overstocks cost retailers USD 1.7 trillion a year, with out-of-stocks making up 65.6% of that total.
- Retail customer analytics: Groups shoppers by behavior and value, which supports targeted offers and loyalty programs.
- Retail performance analytics: Compares stores, regions, and staff using measures such as conversion rate and sales per square foot.
- Pricing and promotion analytics: Measures how discounts affect volume and margin, so teams can drop offers that cut margin without lifting sales.
Key metrics to track
The table below lists the metrics most retail teams check every week, along with what each one tells them.
| Metric | What it measures | Why it matters |
|---|
| Sales per square foot | Revenue earned for each unit of store space | Shows how well space and layout perform |
| Conversion rate | Share of visitors who make a purchase | Reveals issues with staffing, stock, or layout |
| Average transaction value | Average amount spent per purchase | Guides bundling and upselling efforts |
| Sell-through rate | Share of received stock sold in a period | Signals when to reorder or mark down |
| Inventory turnover | How often stock sells and is replaced | Highlights cash tied up in slow stock |
| GMROI | Gross margin earned per unit of inventory cost | Shows which products truly make money |
| Customer lifetime value | Total expected revenue from one customer | Helps set loyalty and marketing budgets |

Want a clear view of your sales, stock, and customers in one dashboard?

How AI-powered retail analytics changes the picture
Standard reports mostly look backward. With AI-powered retail analytics, teams can also forecast demand and get suggestions on what to do next. Retailers exploring AI for retail usually start with these capabilities:
- Demand forecasting: Machine learning models combine past sales, seasons, promotions, and weather to predict demand at the store and product level.
- Anomaly alerts: The system watches metrics continuously and flags unusual changes, such as a sudden sales drop in one region.
- Plain-language questions: Managers can type a question like “Which stores missed target last week?” and get a chart in return.
- Recommendations: Prescriptive models suggest actions, such as moving stock between stores or adjusting a price.
That said, these models need accurate data. A forecast built on wrong stock counts will be wrong too, so most retailers clean up their data before switching on AI features.
Retailers can buy a ready-made tool or build a platform around their own systems. The right option depends on budget, timelines, and how standard the existing systems are.
- Off-the-shelf tools: Faster to launch and cheaper upfront. They work well when data sources are standard and reporting needs are common.
- Custom platforms: Take longer to build, yet fit unique workflows, legacy systems, and specific KPIs. They also avoid paying for features nobody uses.
- Hybrid approach: Many retailers use a standard BI tool for dashboards and add custom connectors, data models, or apps on top.
For businesses that need tailored dashboards, store apps, or data connectors, a development partner can help. Explore retail app development services to connect systems that packaged tools may not support.
Before signing a contract, test each option against these points:
- Integrations: Check that it connects to the POS, ecommerce, ERP, and CRM systems already in use.
- Ease of use: Store managers and buyers should be able to read dashboards without help from analysts.
- Scalability: Make sure it can handle more stores, channels, and data as the business grows.
- AI features: Check whether forecasting and alerts fit how the team plans stock and promotions today.
- Security: Confirm role-based access, encryption, and compliance with local data protection laws.
- Total cost: Add licenses, setup, training, and ongoing support to see the real cost over three years.
Rolling out the platform in phases lets teams test it on a small scale before committing fully. A typical plan looks like this:
- Set goals: Pick two or three business problems to solve first, such as stockouts or weak promotions.
- Audit data: List every data source, check its quality, and fix gaps before connecting it.
- Start small: Launch with one region or category, then measure results against a clear baseline.
- Train teams: Show each role which dashboards matter to them and how to act on them.
- Expand and refine: Add more data sources, stores, and AI features once the first phase proves its value.
Common challenges to plan for
These are the problems that come up most often during setup:
- Scattered data: Product codes and customer records often differ across systems, so matching them takes time.
- Poor data quality: Missing or outdated records lead to wrong conclusions, which erodes trust in the platform.
- Low adoption: Teams fall back on spreadsheets if dashboards feel complex or unrelated to their work.
- Privacy rules: Customer data must be handled in line with regulations such as GDPR.
Conclusion
A retail analytics platform gives retailers one place to track sales, stock, and customers. In most cases, the first gains show up in inventory, followed by better promotions and more targeted marketing.
Retailers that start with a few clear goals and clean data usually see results sooner, whatever their size.
FAQs
Popular examples include Microsoft Power BI, Tableau, and Looker for general reporting, plus retail-focused tools such as Oracle Retail Analytics and RetailNext. Many retailers also build custom platforms around their own systems.
Walmart uses in-house AI models to forecast demand across its network and plan inventory well in advance. It also uses AI agents to give merchants a unified stock view and find root causes of stockouts.
Retailers commonly group shoppers into loyal customers, impulse buyers, discount seekers, and need-based customers. Customer analytics helps identify each group, so offers and messages can match how each one shops.
Yes, small retailers gain clear views of best sellers, slow stock, and loyal customers without hiring analysts. Affordable cloud tools and phased setups keep costs low while still improving everyday buying and pricing decisions.
Chand Prakash founded CodeTrade India and continues to lead it as CTO, shaping the technical direction of the company since its early days. He has spent his career solving hard engineering problems and building teams that ship reliable software, with a focus on ERP, e-commerce, and custom enterprise platforms.




 Chand Prakash
06 November 2026
 Chand Prakash



 Hardik Soni