







Mobile App Development
 Chand Prakash
30 September 2026
Chand Prakash
30 September 2026
How to Structure Your Flutter Enterprise Architecture for Multiple Teams?
 Chand Prakash
A dropped frame occurs whenever the application fails to produce it in time. The speed of your GPU rendering pipeline becomes completely irrelevant if that frame never arrives. This fundamental truth completely reorders traditional flutter performance advice for scaling mobile applications.
The dominant cause of production jank remains heavy synchronous work blocking the Flutter UI isolate directly. Engineering teams frequently spend weeks optimizing widgets or complex shaders without seeing any measurable improvement. This reality became even more apparent after Impeller successfully eliminated the historical shader compilation stutter.
Technical leaders must shift their Flutter app optimization strategies away from outdated rendering fixes. Proper Flutter performance testing requires diagnosing the exact bottlenecks stalling your main execution thread. Informed by enterprise Flutter app development services, this comprehensive guide explores what actually causes production jank and how Impeller shifted modern architectural priorities.
It also details how to accurately interpret Flutter DevTools performance metrics on real mid-range hardware. Finally, the post examines exactly what maintaining a strict Flutter 120fps budget demands from your codebase.
Impeller precompiles shaders instead of compiling them directly at runtime. This fundamental shift removed a specific and genuinely annoying framework failure. Previously, the first run of an animation stuttered while shaders compiled before running smoothly forever after.
Current status per Flutter’s documentation:
| Platform | Status |
|---|---|
| iOS | The only renderer available; developers cannot select Skia. |
| Android | Default on API 29 and above; falls back to the legacy OpenGL renderer below that or without Vulkan. |
| macOS | Currently accessible only behind a specific feature flag. |
| Web | Not used; web environments continue rendering with Skia. |
Understanding exact technical bottlenecks causing dropped frames helps engineering teams execute effective Flutter performance optimization strategies very quickly. We ordered these common bottlenecks by how often they remain the actual root cause.
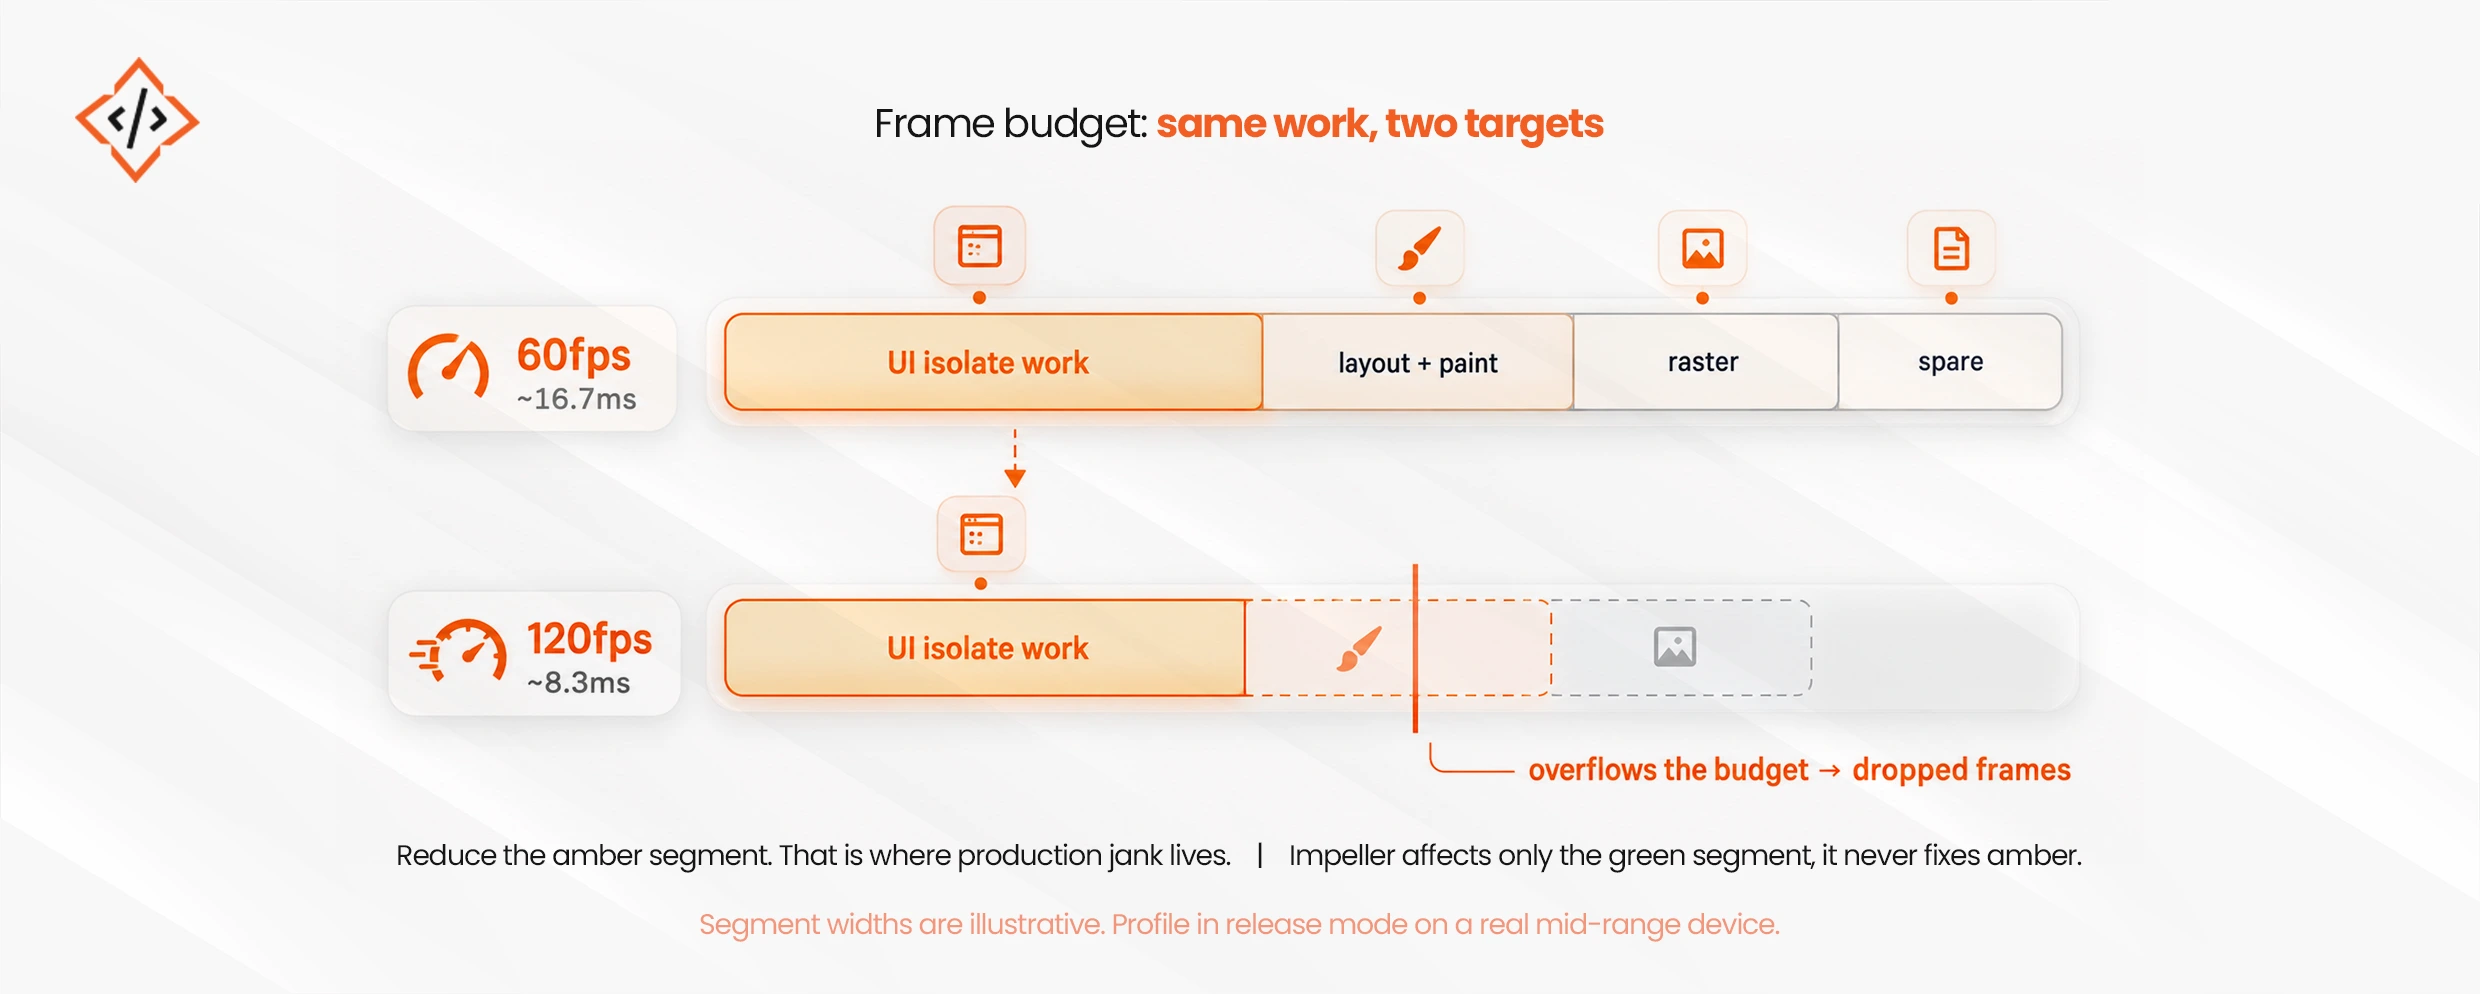
Halving your frame budget never changes the actual underlying computational workload. It simply restricts exactly what computational work still successfully fits.
Three rules govern proper profiling. Breaking any of them means your measurements fail to describe actual user experience.
A reliable routine requires reproducing the janky interaction while recording a timeline. Find specific frames exceeding your allocated performance budget. Then determine whether UI or raster operations dominate the workload. Dart code remains the culprit when the Flutter UI isolate dominates.
Always measure scripted scenarios rather than vague visual impressions. Stating that scrolling feels smoother is never a valid technical result. Documenting that 99th percentile frame times fell from 34ms to 11ms proves real progress.
Do not seek to hire Flutter developer or book an external performance engagement before profiling the application internally. Run DevTools on a mid-range device for an afternoon first. Engineering teams often discover a misplaced shrinkWrap property on long lists and fix it independently within minutes.
Vague complaints stating an application feels slow without documented user scenarios cannot be properly evaluated or scoped. Technical teams must isolate at least one reproducible interaction with attached frame timings before initiating formal Flutter performance optimization work.
Chasing Flutter 120fps for standard enterprise business applications often wastes valuable engineering hours unnecessarily. Technical leaders should prioritize reliable baseline responsiveness over arbitrary high-refresh targets driven purely by executive presentations.
Targeting Flutter 120fps remains strictly worthwhile only on supported displays for highly perceptible interactions like scrolling or direct-manipulation gestures.
The frame budget halves from roughly 16ms to approximately 8ms. This creates one specific consequence. Work remaining completely invisible at 60fps becomes a dropped frame at 120fps. A 10ms parse fitting previously now fails the budget completely.
Three specific requirements follow.
Worth stating plainly for most business applications. Reliable 60fps performance remains worth significantly more than intermittent 120fps. A consistently smooth 60fps experience feels better than a 120fps application dropping frames unpredictably.
Prioritizing the highest impact technical adjustments allows teams to achieve measurable Flutter app performance gains without wasting engineering resources.
| Fix | Typical Impact | Effort |
|---|---|---|
| Implement ListView.builder instead of building all children | Very high on list screens | Low |
| Move parsing and decoding off the Flutter UI isolate | Very high across application flows | Low to medium |
| Narrow state subscription scope and add const constructors | High for dynamic screens | Medium |
| Configure cacheWidth and cacheHeight for image decoding | High on image-heavy screens | Low |
| Remove shrinkWrap properties on long lists | High where present | Very low |
| Simplify or remove expensive blur and shadow effects | Medium to high | Low |
| Flatten deeply nested layout structures | Medium | Medium |
| Apply itemExtent on fixed-height lists | Medium | Low |
| Execute legacy shader warm-up routines | None on Impeller platforms | None |
| Upgrade target device hardware assumptions | None for existing users | None |
All previous advice assumes developers can easily reproduce the specific jank. This often remains completely impossible in actual production environments.
The most difficult Flutter app performance issues appear only on specific devices under exact network conditions after prolonged application runtime. Crash reporters successfully catch standard application crashes. Production frame timing provides much thinner ground for accurate diagnosis. Shipping a frame-timing callback aggregates performance percentiles effectively. However, this generates raw numbers lacking the specific context required for meaningful technical action.
A massive diagnostic gap exists between identifying poor p99 frame times and knowing the exact screen, device class, or interaction. Bridging this gap requires extensive custom instrumentation. Unfortunately, placing custom instrumentation directly on the Flutter UI isolate creates additional jank itself.
No perfectly clean technical solution currently exists for this complex scenario. Professional engineering teams sample user sessions aggressively instead. They instrument a tiny percentage of active sessions and accept a coarser overall diagnostic picture. Engineering leaders must carefully weigh this sampling approach against the alternative of manual Flutter performance testing across diverse physical hardware.
Mastering flutter performance in production requires acknowledging that dropped frames overwhelmingly originate within the Flutter UI isolate. Modern rendering engines like Impeller eliminated historical shader compilation stutter entirely. Faster graphics processing cannot salvage a frame that arrives late because synchronous Dart code blocked execution.
Effective Flutter app optimization demands precise Flutter performance testing on real mid-range hardware in release mode. Teams must use Flutter DevTools performance metrics to verify whether UI or raster operations actually dominate late frames. This critical distinction prevents wasting weeks on irrelevant rendering tweaks that unnecessarily inflate your overall Flutter app development cost.
Prioritize practical Flutter performance optimization techniques like moving heavy JSON parsing off the main thread. Implementing rigorous Flutter lazy loading and sizing images at decode time resolves most real world architectural problems. These straightforward structural adjustments deliver far better user experiences than aggressively chasing an unstable Flutter 120fps target. Delivering a perfectly consistent 60fps interface always feels significantly more premium than rendering higher framerates unpredictably.
 Chand Prakash
 Chand Prakash
 Chand Prakash
 Abhishek Karad
 Abhishek Karad