


Salesforce
AI
 Chand Prakash
19 October 2026
Salesforce AI Automation: Use Cases for Sales and Customer Service
 Chand Prakash

Most CRM managers hear about performance problems second-hand. A sales rep says the opportunity page takes forever to open. A service lead says cases save keep failing during busy hours. Finance says the pipeline report times out every Monday. Each complaint sounds small, but together they push people away from the CRM and back to spreadsheets.
Salesforce performance optimization is the work of finding where time is lost in your org and fixing the biggest causes first. This guide is written for the people who own the org day to day: Salesforce admins, CRM managers, and sales or service operations leads. It explains each cause in plain terms and shows which fixes an admin can handle and which need a developer.
Salesforce usually slows down because years of small additions pile up. Each new component, flow, field, integration, or report adds a little work to every page load or save. No single change feels heavy, but together they make the org sluggish.
Most Salesforce performance issues come from five places:
The table below links common symptoms to their likely cause and the person who usually fixes them.
| What users notice | Likely cause | Who usually fixes it |
|---|---|---|
| Record pages take a long time to open | Too many components or related lists | Admin |
| Saving a record is slow on one object | Overlapping flows, triggers, or validation rules | Admin and developer |
| "Unable to lock row" errors at busy times | Data skew or parallel bulk jobs | Admin and developer |
| Reports time out | Broad filters or very large data sets | Admin |
| Overnight integration jobs fail | Large batches, slow external systems, or API limits | Developer |
| The whole org gets slower over months | Data growth without archiving or indexes | Admin and developer |
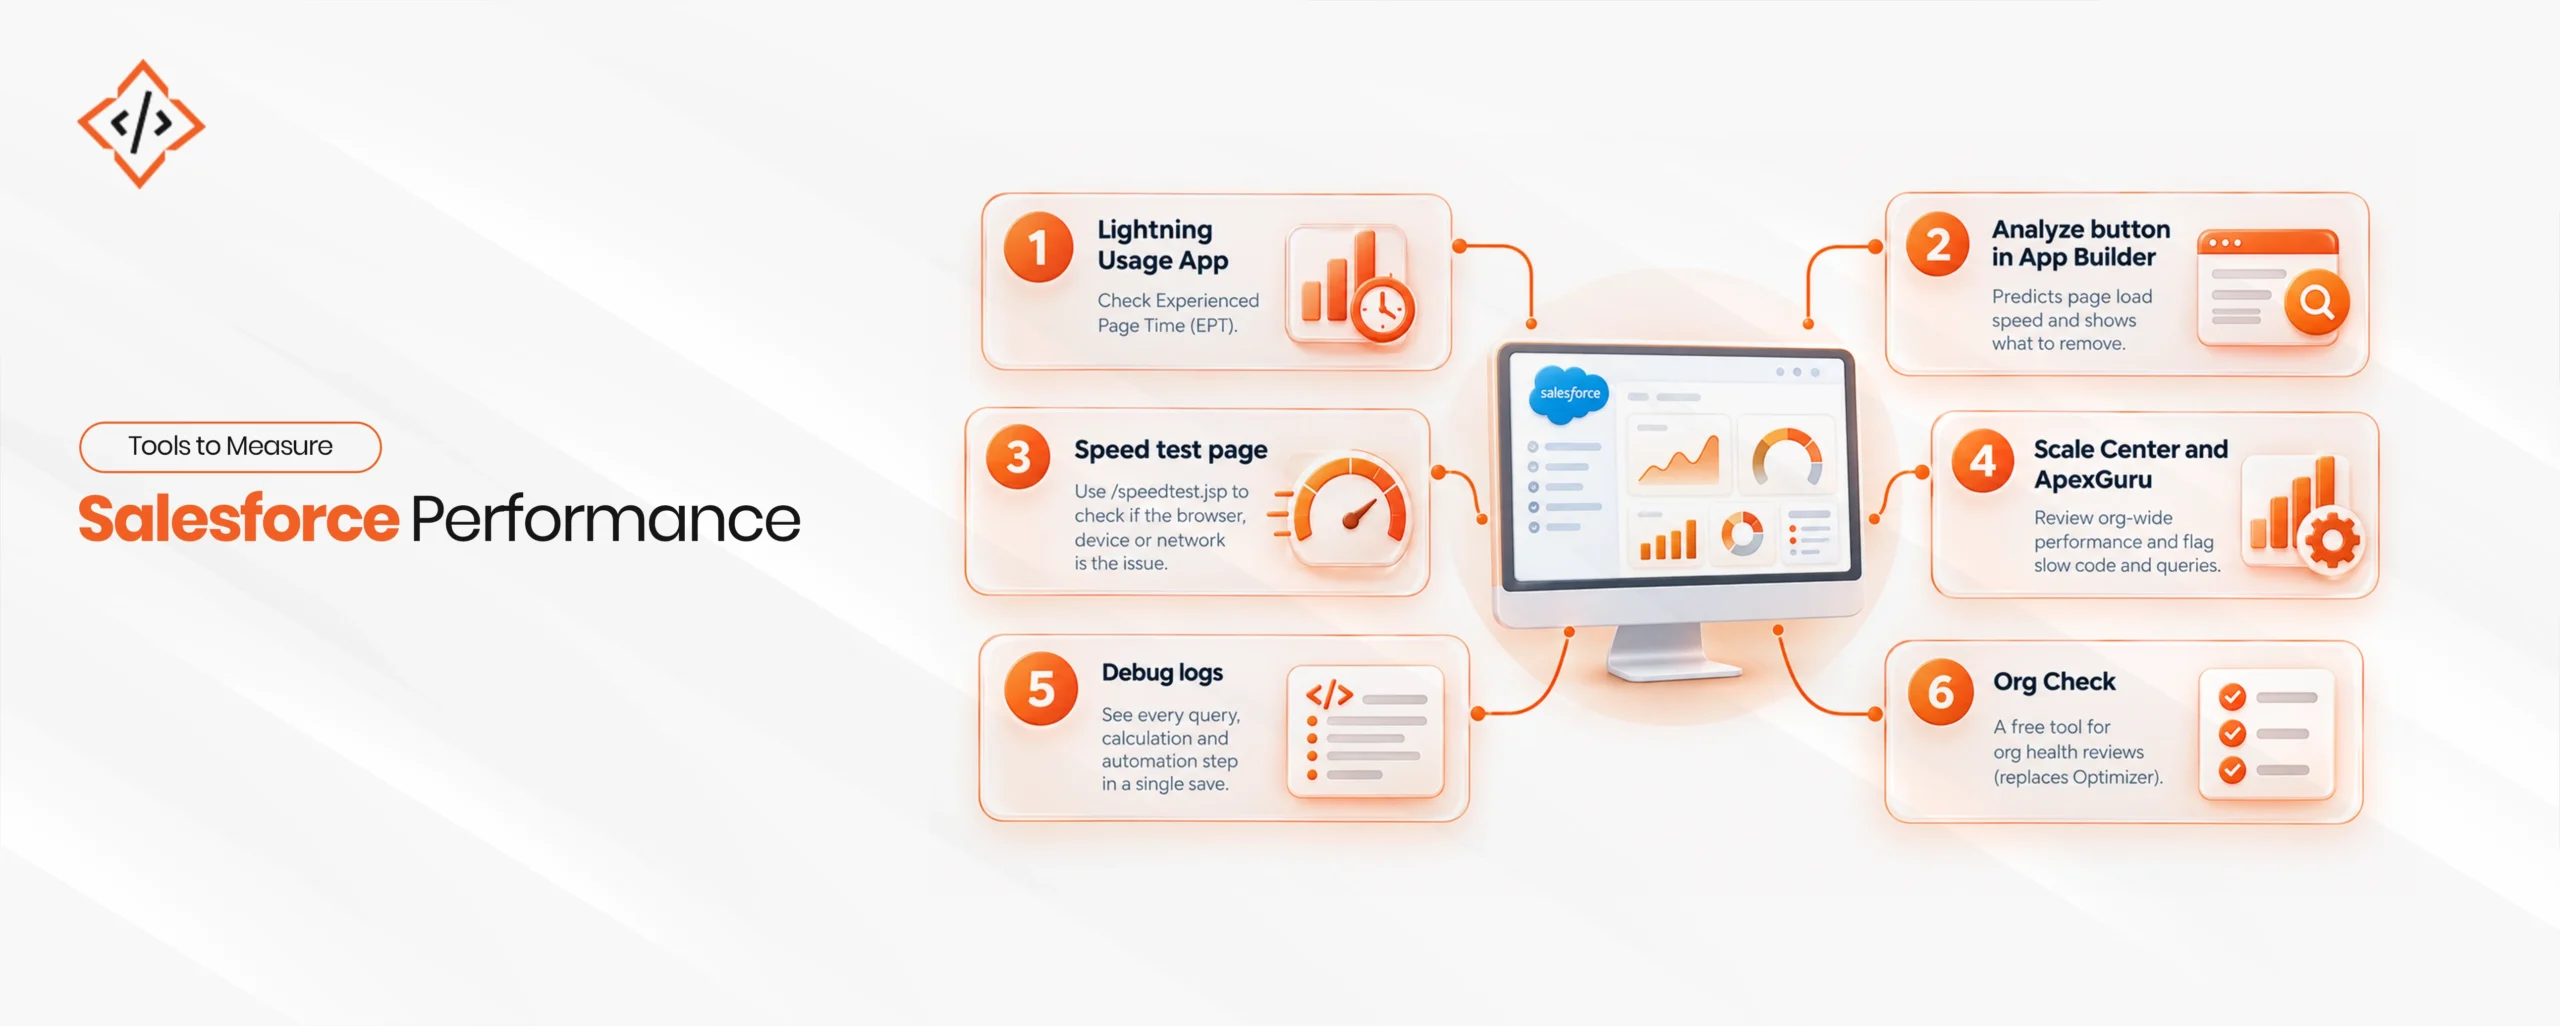
Measure first so you know what you are fixing and can prove that it worked. Pick the three to five workflows users complain about most, such as opening an opportunity or saving a case, and record how long they take today.
Salesforce includes several free tools for this:
Write down the timing, the number of records involved, and the time of day for each test. Run each test a few times, because one slow result can be bad luck, while a pattern points to a real problem.
You can improve Lightning page speed by loading less on each page and letting the browser reuse what it has already downloaded. This is usually the fastest win, because most of it is configuration an admin can change without code.
A record page loads every visible component at once. Each report chart, related list, and custom component runs its own query. Start with these changes:
Think about the main task on each page. A sales rep on an opportunity needs the stage, amount, next step, and key contacts. Put those first, and move everything else lower or into tabs.
In Session Settings, Salesforce offers an option to enable secure and persistent browser caching. When it is on, the browser stores parts of Lightning so pages load faster on repeat visits. Check this setting early, because it is a quick switch that some orgs have turned off.
Installed apps from AppExchange can add heavy components to your pages. Test a page in a sandbox with and without the component, and compare the Analyze score. If one component slows the page sharply, raise it with the vendor.
Field teams often use the Salesforce mobile app on slower connections. Keep mobile layouts short, and test key pages on a real phone over a normal mobile network, not only on office Wi-Fi.
Slow saves usually come from code, queries, or automation that does more work than needed. Salesforce performance tuning at this level means finding that extra work and removing it.
Apex is Salesforce’s programming language, and SOQL is how it reads data. Both run inside strict limits for each save, so inefficient code can slow pages or cause errors when many records change at once.
The most common problems a developer will look for:
If your org has years of custom code from different developers, a code review is often the fastest path to real gains. Experienced Salesforce development services teams can trace the slowest transactions and fix them without changing how the business works.
Every flow, trigger, and validation rule on an object runs during the same save. When several people build automation over several years, nobody remembers what fires when, and saves slow down.
Salesforce ended support for Workflow Rules and Process Builder on December 31, 2025. They still run, but they no longer get fixes. Use this as a chance to combine automation, not just copy each old rule into a new flow.
Practical flow fixes include:
When automation keeps growing, it helps to plan it as a system rather than a list of rules. Salesforce AI automation can replace stacks of manual rules with fewer, smarter processes, as long as each one is tested for performance before release.
More data means more work for every query, report, and save. A query that is instant with 5,000 records can crawl with 5 million. Salesforce database optimization keeps that growth under control.
Data skew happens when one record has a very large number of related records. Salesforce’s Large Data Volumes guidance describes skew as more than 10,000 child records under one parent. A common example is a single “Unassigned” account that collects hundreds of thousands of contacts or cases.
When many users or jobs update records under the same parent, Salesforce has to lock that parent. The others wait, and some fail with an “unable to lock row” error. If saves are slow only at busy times, check for skew before changing any code. Spreading records across several parent accounts or owners usually fixes it.
Indexes help Salesforce find records quickly, like the index at the back of a book. Standard fields such as record IDs, names, and lookups are indexed already. For other fields that you filter on often, you can ask Salesforce Support to add a custom index.
Agree on data retention rules with finance and compliance before you delete anything.
Integrations and AI agents add work that users do not see. When a save has to wait for an ERP, a billing system, or an AI response, the user waits too. These are now some of the most common causes of poor Salesforce CRM performance.
If a user does not need an answer from another system right away, the request should run in the background. Developers can use Platform Events, Change Data Capture, or background Apex jobs to send data after the save finishes.
Other integration checks:
A quick inventory helps. List every system that connects to Salesforce, note whether users wait for it, and mark the ones that fail most often. The worst offender usually shows up within an hour.
AI agents read records, run flows, and call Apex to complete their tasks. One agent conversation can trigger many queries, and dozens of agents running at once add up quickly. An agent that searches too broadly can also slow down the pages and reports your users depend on.
Before rollout, test each agent like any other heavy integration:
Teams building custom agents on top of CRM data often work with specialists in AI agent development, so that agent actions are designed for performance from the start.
Review performance after every Salesforce release and after any major change to your org. Salesforce ships three releases a year, in spring, summer, and winter. Each one can change how features behave, so rerun your baseline tests in a sandbox before and after each upgrade.
Also review performance when you:
A short quarterly check of your top workflows catches slow growth before users start complaining.
Admins can handle many fixes on their own, such as page layouts, browser caching, report filters, and simple flow cleanup. Outside help makes sense when the cause sits in custom code, data model design, data skew, or complex integrations.
Salesforce consulting services are most useful for diagnosis. A specialist can trace the slowest transactions, rank fixes by impact, and hand clear tasks back to your team. Ongoing Salesforce optimization services then help keep the org fast as data and users grow.
Salesforce performance optimization works best as a habit, not a one-time project. Measure the workflows that matter most, fix the biggest cause first, and test again after each change. Many of the fastest wins, such as lighter pages, browser caching, and cleaner automation, need no code at all.
As your org adds data, integrations, and AI agents, the work shifts toward Salesforce application optimization and system optimization at a deeper level. A regular review after each release keeps the CRM fast enough that people want to use it.
Common causes include heavy lightning pages, inefficient code, overlapping flows, large data volumes, data skew, and slow integrations. Browser and network issues can also play a part, so measure before fixing.Move rarely used components into tabs, use visibility rules, trim related lists, and turn on secure browser caching. Then check the page with the Analyze button in Lightning App Builder.Use debug logs in the Developer Console to see queries and processing time for a save. The Query Plan tool, Scale Center, and ApexGuru help pinpoint the slowest code.Yes. Several flows on the same object, broad entry conditions, or lookups inside loops all add time to each save. Combining flows and using before-save flows usually helps.Larger data sets make queries, reports, and saves slower. Data skew adds record locking. Indexes, selective filters, archiving, and spreading records across parents keep growth under control.Not always. Page cleanup, caching, report filters, and flow consolidation need no code. Custom development is needed when the slowdown comes from Apex, data design, or integrations.Salesforce retired Optimizer starting with Winter '26. Org Check, a free Salesforce Labs tool, is the common replacement for org health reviews, though it is community-supported rather than officially supported.Review it after each of Salesforce's three yearly releases and after major changes. A short quarterly check helps you improve Salesforce performance before users notice a slowdown.